Likert Scale: What It Is, 30 Example Questions, and How to Analyze the Results


If you need to build a Likert scale survey today, this page covers all three parts of the job: 30 ready-to-copy question examples organized by use case, a table to decide how many points to use, and a step-by-step guide to the analysis, including the mean score calculation with a worked example.
The analysis part deserves special attention: it’s precisely when interpreting the results that surveys lose their value.
What is the Likert scale
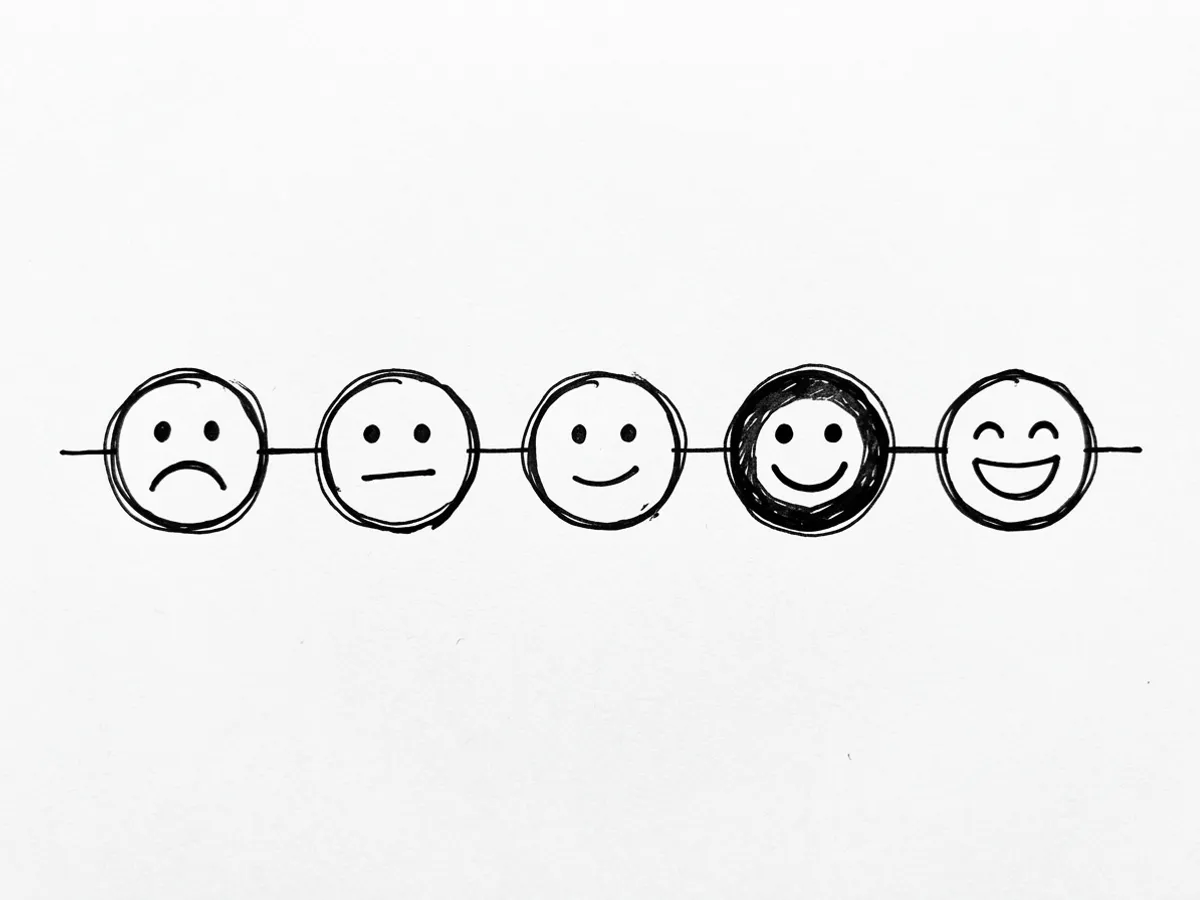
The Likert scale is a question format in which the respondent indicates how much they agree or disagree with a statement by choosing a point on a symmetric scale. It was proposed by psychologist Rensis Likert in 1932 and became the standard for measuring attitudes, perceptions, and satisfaction in surveys. The most common format has 5 points:
| 1 | 2 | 3 | 4 | 5 |
|---|---|---|---|---|
| Strongly disagree | Disagree | Neither agree nor disagree | Agree | Strongly agree |
The same structure works with other labels, such as frequency (never to always), satisfaction (very dissatisfied to very satisfied), or importance (not important to essential).
30 Likert scale question examples
All the items below use the 5-point agreement scale from the table above, unless noted otherwise. Copy them, adapt the terms to your context, and keep one rule: each statement measures one thing only. Double-barreled statements, like “the support was fast and solved my problem,” produce answers that are impossible to interpret.
Customer satisfaction (CSAT)
- The support team solved my problem on the first attempt.
- The support response time met my expectations.
- The purchase process was simple.
- The product quality matches what was advertised.
- I easily found the information I needed.
- I would recommend this company to a colleague.
Item 6 looks like the NPS question, but in agreement format. If your goal is to track recommendation as a metric over time, use the NPS on the standard 0-to-10 scale, which allows comparison with market benchmarks.
Employee engagement and eNPS
- I feel my work is recognized by leadership.
- I have the tools I need to do my job well.
- I receive clear feedback about my performance.
- I see real growth opportunities at this company.
- Communication between departments works well.
- I can balance work and personal life in my current routine.
In engagement surveys, anonymity changes the quality of the answers. Make it explicit at the start of the form that responses are not identified, and resist the temptation to ask for data that could identify the person, such as role and team at the same time in small teams.
Post-event
- The content presented matched what the event promised.
- The session length was appropriate.
- The speakers had a strong command of the topics they presented.
- The event logistics (check-in, signage, schedule) worked well.
- The event was worth the time I invested.
- I would attend a future edition.
Send the post-event survey within 48 hours, while memories are fresh. Items 17 and 18 work as a summary of the whole set: when the other items score high but these two drop, something the survey didn’t cover bothered the audience, and it’s worth adding an open-ended field right after them.
Product feedback
- The product is easy to use day to day.
- The features meet my current needs.
- The relationship between price and value delivered is fair.
- I trust the product’s stability.
- I easily find help when I have a question.
- I would miss the product if it stopped existing tomorrow.
Item 24 is a Likert adaptation of the classic product-stickiness question and tends to be the best predictor of the set: people who strongly agree with it tend to stay as customers. Track this item over time, segmented by plan or tenure, instead of looking only at the overall average of a single round.
Academic research and theses
- Classes balance theory and practice in a well-rounded way.
- The course materials provided are sufficient to keep up with the subject.
- The grading criteria were communicated clearly.
- I feel comfortable asking questions during class.
- The course workload is compatible with the available time.
- The course contributes to my professional preparation.
In academic research, keep the items pointing in the same direction whenever possible. Reverse-coded items, like “I have difficulty keeping up with classes,” require recoding during analysis and confuse inattentive respondents. If your advisor asks for reverse-coded control items, document the reversal in the methodology and recode before calculating any statistics.
5 writing mistakes that distort your data
Before choosing the number of points, review your items against this list. Each of these mistakes shows up frequently in real surveys and contaminates the data in a way no analysis can fix afterward:
- Double-barreled statements. “The support was fast and solved my problem” mixes two measures. Someone who got a fast response that solved nothing has no way to answer. Split it into two items.
- Leading wording. “Did our award-winning support solve your problem?” nudges the answer. Write the item neutrally and leave the opinion to the respondent.
- Double negatives. “I don’t think the product is hard to use” forces the respondent to solve a logic puzzle. Does agreeing mean it’s easy or hard? Always prefer the direct affirmative form.
- Flipping the scale direction mid-form. If 5 means strongly agree in the first questions, it needs to mean the same until the end. Respondents on autopilot don’t notice the switch, and the data turns into noise.
- Unlabeled points. Bare numbers with no anchors produce different interpretations of the same point. Label every point when the format allows it, as in the table at the start of this guide. On numeric scales anchored only at the extremes, a common format in digital forms, make sure the two labels define the direction of the scale without ambiguity.
5, 7, or 10 points?
The classic study on the subject is by Preston and Colman, published in Acta Psychologica in 2000. The authors compared scales from 2 to 11 points on the same items, plus a 101-point scale in a separate format, and measured reliability, validity, and discriminating power. The result: scales with 2 to 4 points performed worse, the indices improve up to around 7 points, and test-retest reliability drops on scales with more than 10. Respondents preferred the 10-, 7-, and 9-point scales, in that order. The study is available on ScienceDirect.
The choice depends on what you’ll do with the data:
| Points | When to use | Cost |
|---|---|---|
| 5 | Customer surveys and general use. Simple to answer on mobile and easy to compare across periods. | Less sensitive to small variations in opinion |
| 7 | Academic surveys and studies that need to detect smaller differences between groups | Intermediate labels become harder to name clearly |
| 10 or 11 | Almost never in classic Likert. If you want 0 to 10, you probably want NPS | Above 10 points retest reliability drops, and the scale becomes a rating, not agreement |
| 4 or 6 (even) | When you need to force a stance and eliminate the neutral point | Annoys some respondents and increases abandonment on sensitive topics |
If in doubt, use 5 points. It’s the format your respondents already know, it works well on small screens, and it simplifies comparing results across surveys.
Likert scale, NPS, or CSAT?
All three measure perception, but they answer different questions:
| Method | What it measures | Typical scale | Use when |
|---|---|---|---|
| Likert scale | Degree of agreement with specific statements | 5 or 7 points | You want to diagnose specific aspects of an experience |
| NPS | Likelihood of recommendation | 0 to 10 | You want a single loyalty metric, comparable with the market |
| CSAT | Satisfaction with a specific interaction | 1 to 5 | You want to measure a specific moment, like a support case or purchase |
They complement each other. A common survey format combines the NPS question at the start with 4 to 6 Likert items right after, so the overall score comes with the diagnosis of what explains it.
How to analyze Likert scale results
The path below works for any Likert survey, from CSAT to a thesis.
1. Code the responses
Assign a number to each point on the scale: strongly disagree is worth 1, strongly agree is worth 5. For reverse-coded items (for example, “I have difficulty finding help”), invert the coding before any calculation, otherwise the item pulls the average in the wrong direction.
2. Look at the distribution before any average
Count how many responses landed on each point. The distribution shows patterns the average hides: an item with many responses at 1 and many at 5 indicates divided opinions, and an average near 3 would misleadingly suggest indifference.
3. Calculate the mean score
The mean score is the weighted average of the responses. A worked example, with 40 responses to the item “the support team solved my problem on the first attempt”:
| Response | Code | Responses | Code × responses |
|---|---|---|---|
| Strongly disagree | 1 | 2 | 2 |
| Disagree | 2 | 5 | 10 |
| Neither agree nor disagree | 3 | 8 | 24 |
| Agree | 4 | 15 | 60 |
| Strongly agree | 5 | 10 | 50 |
| Total | 40 | 146 |
Mean score = 146 ÷ 40 = 3.65. The result sits between neutral (3) and agree (4), closer to agree. Reported alone, however, the 3.65 hides that 17.5% of respondents disagreed. That’s why step 2 comes first.
Two complementary metrics help with the reading:
- Mode: the most chosen point. In the example, 4 (agree).
- Top-2-box: the percentage of responses on the two highest points. In the example, (15 + 10) ÷ 40 = 62.5%. It’s the simplest metric to communicate to people who don’t follow research closely.
A second example shows why the distribution comes before the average. Consider another item with the same 40 responses distributed like this: 15 at strongly disagree, 2 at disagree, 3 at neutral, 2 at agree, and 18 at strongly agree. The mean score is 3.15, a number apparently close to the 3.65 of the first example. The reading, however, is the opposite: the first item has moderately positive consensus, and the second has an audience split into two extremes, with 37.5% strongly disagreeing and 45% strongly agreeing. A report showing only the averages would treat the two items as similar and hide exactly the most important finding of the survey.
To interpret the mean score of an agreement item on a 5-point scale, a common reading guide in research reports: below 2.5 indicates predominant disagreement, between 2.5 and 3.4 indicates division or neutrality, and from 3.5 up indicates agreement, stronger the closer it gets to 5. Treat the ranges as a reading convention, not a statistical standard, and adjust the cutoffs to your survey’s context.
In an academic context, one caveat: the Likert scale produces ordinal data, and there’s a long-standing debate about using means on data of this type. For business decisions, the mean score alongside the distribution does the job. In a thesis, also report the median and the mode, and explain the choice in your methodology.
4. Tabulate in a spreadsheet
With the coded responses in one column, two formulas cover the essentials in Google Sheets or Excel: =COUNTIF(range,4) counts the responses at each point to build the distribution, and =AVERAGE(range) calculates the mean score. Exporting your form’s responses to a spreadsheet, tabulating an entire survey takes minutes.
5. Choose the right chart
Horizontal stacked bars show the distribution of several items at once and are the standard for Likert survey reports. Diverging bars, with the neutral at the center, make it easier to compare items with divided opinions. Avoid pie charts: with 5 categories per item and several items, they become unreadable fast.
To build the stacked chart in Google Sheets, organize a table with the items in rows and the 5 scale points in columns, filled with the percentages for each point. Select the table, insert a chart, and choose the “100% stacked bars” type. Keep the color order from disagree to agree and use tones that darken toward agreement, so the reader can compare items by the visual pattern without having to read the numbers.
Likert scale in academic research
Three practices separate an instrument a committee accepts from an improvised questionnaire:
Cite the instrument correctly. The original reference is Likert, R. (1932), “A Technique for the Measurement of Attitudes”, Archives of Psychology, no. 140. The record is on APA PsycNet. Strictly speaking, a “Likert scale” is the set of items measuring a construct; each individual statement is a Likert item. Attentive committees enforce this distinction.
Run a pre-test. Apply the questionnaire to a small group before the official data collection. Ambiguous items, scales with confusing labels, and double-barreled statements show up in the pre-test, while there’s still time to fix them.
Check internal consistency. Cronbach’s alpha is the usual indicator that the instrument’s items measure the same construct, and values from 0.7 up are typically treated as acceptable in the literature. Spreadsheets and statistics software like Jamovi, which is free, calculate the alpha in a few clicks.
Report the instrument in full in your methodology. The methods chapter must allow someone else to reproduce the research: describe the number of items, the scale used and its labels, the numeric coding adopted, the treatment of reverse-coded items, and the statistics chosen for the analysis, with the justification for choosing between mean, median, and distribution. In the results, present the frequency table per item before the summary measures. Committees tend to value coherence between what the methods promised and what appears in the results more than statistical sophistication itself.
How to create a Likert scale in Yay! Forms
There are two suitable fields, depending on the format you want:
Matrix field. The statements go in the rows and the scale points in the columns, all labeled. It’s the classic format for applying several items with the same scale on a single screen, and the field adjusts automatically to the device, which solves the common problem of broken tables on mobile. For academic research, the option to shuffle the row order helps reduce order bias across respondents.
Group with Opinion Scale fields. Each statement becomes an Opinion Scale field, with a configurable number of points and labels on the left and right anchors, and the Group field gathers the items into a single step. It’s the numeric format with anchored extremes, useful when you want lighter screens or a number of points different from the default.
In both cases, you can start without building anything by hand: describe the survey in one sentence, like “employee engagement survey with 6 statements on a 5-point Likert scale,” and Yay! Forms AI builds the form with the items, the scale, and the screens. After collection, the AI analysis summarizes open-ended answers and groups the most cited themes, which cuts down the tabulation step. The 7-day free trial doesn’t ask for a credit card.
Frequently asked questions
Is the Likert scale qualitative or quantitative?
The Likert scale is treated quantitatively, although it produces ordinal data: the categories have an order, but the distance between them isn’t guaranteed to be equal. In applied research, the analysis uses frequencies, mean scores, and statistical tests appropriate for ordinal data. The statement itself captures a qualitative perception, and the scale converts it into an analyzable number. In academic work, the safest approach is to describe the variable as ordinal and justify in the methodology how it was analyzed.
How many points should a Likert scale have?
Use 5 points as the default and 7 when you need more sensitivity to detect small differences between groups. Preston and Colman’s research (2000) showed that data quality improves up to about 7 points and that test-retest reliability drops above 10. Scales with 2 to 4 points had the worst performance in the study. Beyond that, the gain is small and the cost of labeling the intermediate points grows.
How do you calculate the average of a Likert scale?
Code the responses from 1 to 5, multiply each code by the number of responses it received, add everything up, and divide by the total number of respondents. That result is the mean score. With 2 responses at 1, 5 at 2, 8 at 3, 15 at 4, and 10 at 5, the math is 146 divided by 40, which gives 3.65. Always report the average alongside the distribution of responses, because similar averages can hide very different response patterns.
What is the difference between a Likert scale and a Likert item?
A Likert item is an individual statement with the agreement scale, like “the support team solved my problem.” The Likert scale, in the original 1932 sense, is the set of items that together measure a construct, like satisfaction with support. The distinction matters in academic contexts: a single item does not constitute a scale, and a proper scale goes through internal consistency checks across its items.
How many items should a Likert scale survey have?
Enough to cover what you need to decide, and nothing beyond that. Satisfaction and post-event surveys work well with 4 to 8 items; employee engagement surveys usually use 20 to 40, grouped by dimension; academic instruments follow the construct they’re measuring. The limit that matters is the respondent’s time: past a few minutes of form, abandonment and straight-lining (every answer on the same point) grow. Cut any item whose answer wouldn’t change a decision of yours.
Can I use a Likert scale without a neutral point?
Yes. Even-numbered scales, with 4 or 6 points, remove the middle point and force the respondent to take a stance. The gain is eliminating the neutral as a convenience answer. On sensitive topics, however, or when the person genuinely has no opinion, the forced choice tends to generate discomfort, more abandonment, and less honest answers. Use the even version only when taking a stance is indispensable for the decision the survey feeds.